
Charging science
Why Your EV Does Not Charge at the Advertised Speed
Charger kW is only one limit. Learn how the car, battery temperature, state of charge, voltage, power sharing, and charging curve interact.
Reviewed September 3, 2026 · 11 min read
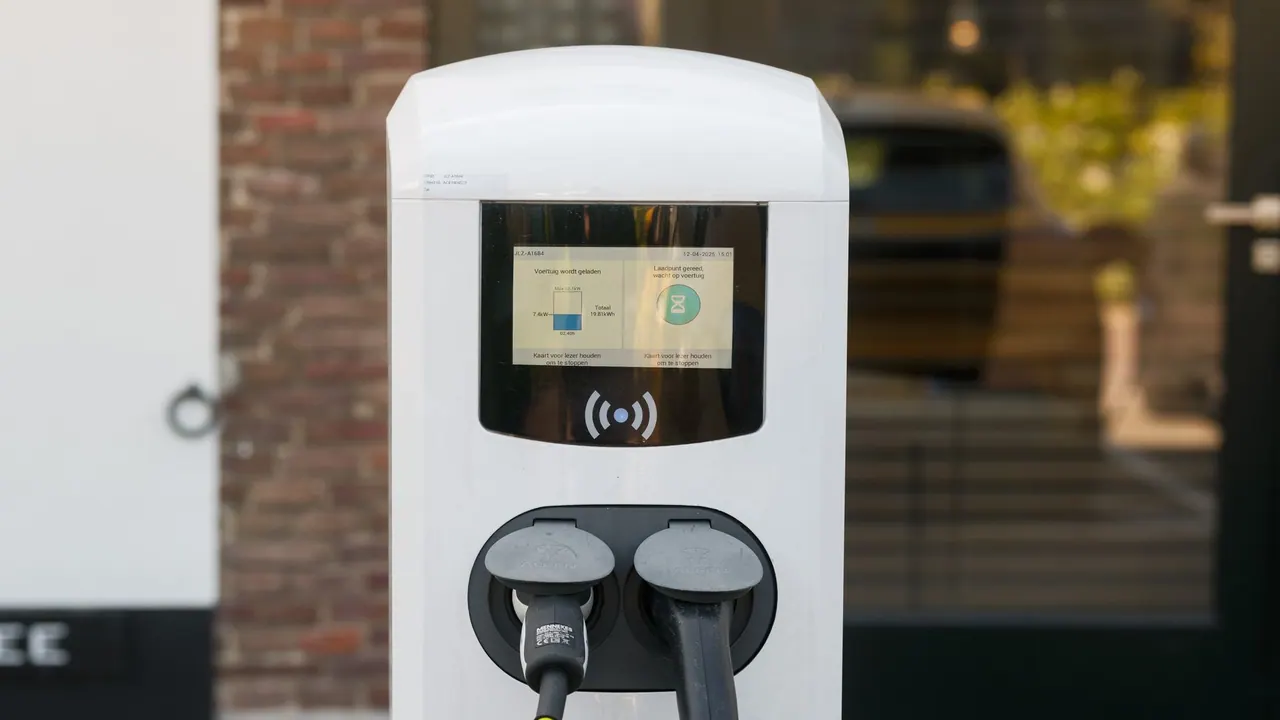
A charger’s advertised kW is a ceiling, not a session guarantee. Actual power is the result of a continuous conversation between the station and vehicle, bounded by the charger, connector, cable, battery pack, temperature, voltage, state of charge, site power, and the vehicle’s protective software.
First, separate kW from kWh
Kilowatts (kW) measure power—the rate of energy transfer at a moment in time. Kilowatt-hours (kWh) measure energy—the amount delivered over time. A constant 100 kW for half an hour would deliver 50 kWh before accounting for changes and losses. Charging rarely stays perfectly constant from plug-in to unplugging.
The lowest limit wins
If a charger can provide 350 kW but the vehicle accepts at most 170 kW, the session cannot exceed the vehicle limit. Likewise, a vehicle capable of 250 kW connected to a 100 kW charger cannot pull 250 kW. Even when both ratings are high, voltage and current compatibility can create a lower real ceiling for a particular pairing.
Station pages on this site display the maximum reported power at the location. That makes the number valuable for screening choices, but it should not be read as the rate every plug supplies to every car.
A charging curve has phases
- Ramp: the vehicle and charger perform checks and increase power toward an acceptable level.
- Peak or plateau: under favorable conditions, the car may hold relatively high power through part of the session.
- Taper: as state of charge rises, the battery management system progressively requests less power.
Department of Energy technical material describing modeled and laboratory-informed fast-charge profiles shows the same essential shape: high-power curves decline as the battery fills. A federal road-trip infrastructure analysis says power generally falls significantly near 80% to 85% state of charge in its modeled vehicle classes.
Battery temperature can dominate the first half
Lithium-ion batteries have a preferred operating temperature range. When the pack is cold, the vehicle may limit charge power until heating brings it into a safer range. In high heat, cooling systems consume power and the vehicle may also restrict charging to protect the pack.
An NREL review of extreme-temperature research reported one cold-climate example in which preconditioning at −10°C reduced charging time from 167 minutes to 120 minutes. That result is not a universal percentage for every EV, but it illustrates why navigating to a fast charger early enough for supported vehicles to prepare the battery can matter.
Shared power and site conditions matter
Some equipment shares a cabinet or site power allocation between plugs. A neighboring vehicle can therefore change the power available to your session. Equipment faults, grid limits, thermal limits in the cable, and maintenance modes can also reduce output. A station’s number of plugs and recent network status are useful context alongside maximum kW.
How to get a better fast-charge session
- Use the vehicle’s navigation guidance when it controls battery preconditioning.
- Prefer arriving at a relatively low state of charge when the route and backup margin safely allow it.
- Choose a charger at least as powerful as the rate your car can use in those conditions.
- Move to another working plug if the network recommends it and performance is abnormally low.
- Leave when additional energy no longer justifies the slower charging rate—unless the next leg requires it.
Peak kW is not the best vehicle comparison
Two vehicles with the same peak can spend very different amounts of time holding it. For road-trip planning, the time required to move through a useful state-of-charge window is more informative than a single peak number. Battery size also matters: the same power adds a smaller percentage per minute to a larger pack.
Use our charging time calculator for a transparent rough estimate, then consult manufacturer charging curves or independent repeat testing for a model-specific answer.